We were sparked to read this paper due to multiple requests from clients at the Stats Central consulting lab, who were attempting to implement structural equation models (SEMs) but did not understand the methodology. An SEM is typically used as a model for multivariate responses that depend on latent variables. The methodology is used mostly in the field of psychometrics, for instance to model someone's score on several tests as reflecting some unobservable latent variable like "spatial intelligence" or "motor skills". The paper by Sanchez et al. provides a nice overview of SEMs for statisticians who don't necessarily keep up-to-date in the psychometrics literature, with two example analyses drawn from the field of environmental epidemiology.
The first example is a model that explains the concentration of lead in four body tissues (umbilical cord blood, maternal whole blood, the patella, and the tibia tibia) via five environmental covariates (time living in Mexico City, age, use of ceramics for cooking [both long-term and recent], and the concentration of lead in the air). This isn't a case you'd normally think of as requiring the use of an SEM, but the model was structured hierarchically so that some of the response variables were also covariates for predicting the others. The figure below depicts the model's structure, with each arrow indicating a linear model. It was reproduced from the manuscript.
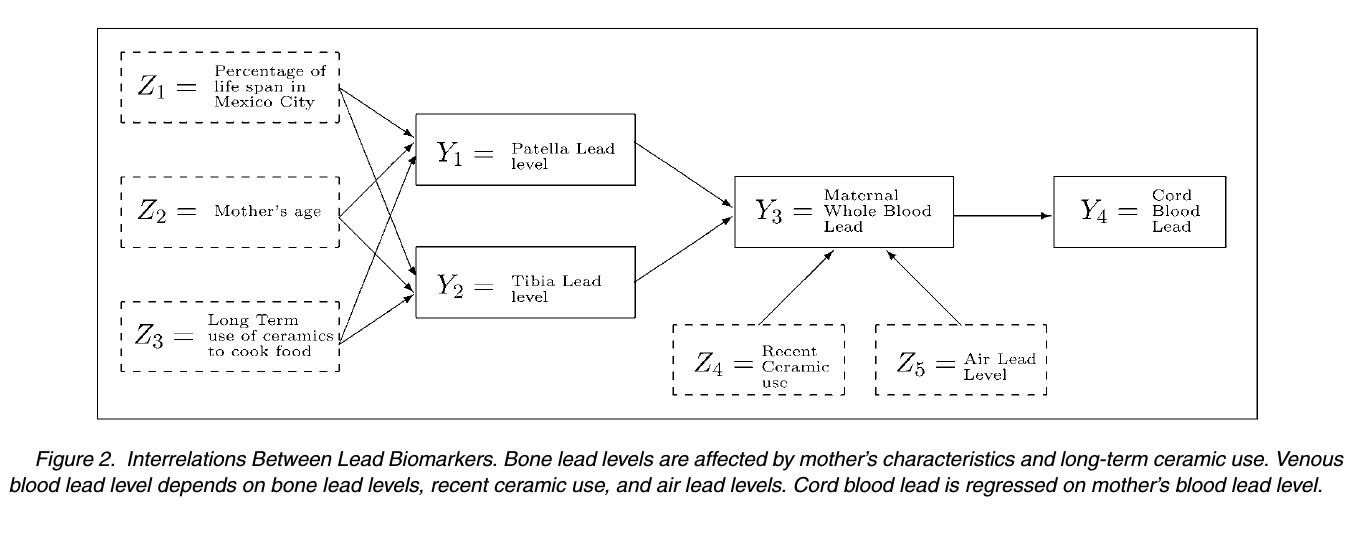
Since there are no latent variables in this model, we wondered whether the result of using an SEM to fit the data jointly will be very different from generating each regression model individually, and using its fitted values as inputs to the next level of the model.
The other example is a model for performance on eleven neurobehavioral tests with mercury exposure as an unobserved covariate that affects the latent factors "motor ability" and "verbal ability". Whale consumption was used to predict the mercury exposure (this study was conducted in the remote Faeroe Islands north of Scotland), with hair and blood mercury used as surrogates that reflect the mercury exposure. The diagram of this model's structure is reproduced below. Note that the double-ended arrow between motor ability and verbal ability indicates that the two latent factors are correlated.

One thing to note from the diagrams is that these models use a lot of parameters and impose a quite specific structure, both of which can be problematic. The number of parameters leads to concerns about the identifiability of SEMs, which must be carefully checked in each case, and the results may be sensitive to the structure, which must be chosen a priori, using the theory of the scientific field being studied. Model checking is discussed in the paper, but in a general way (necessarily, given that this is a review paper).
Both examples use linear models and Gaussian distributions at every stage, though SEMs can be used with more flexible model equations such as GLMs. The R package sem and the STATA package gllamm are called out as the state of the art (circa 2005).
We got to discussing when an Ecostatistician might want to use an SEM in their work, and the discussion focused around our favorite application: multivariate abundance modeling (mvabund). In fact, most kinds of regression and latent variable models seem to be specific cases of structural equation models (though that's not usually the most productive way to think).
In sum, we found this paper to be a well-calibrated review article for statisticians who are looking to quickly understand the SEM methodology and see how it can be used in an example.
Very significant Information for us, I have think the representation of this Information is actually superb one. This is my first visit to your site. Arrow Consulting Sydney
ReplyDeleteReally Great article, Amazing Write Up, I can agree with your point of view. Much appreciation for the information, Really interesting article, It’s well-structured and has good visual description, I would like to thank you for putting the time together to construct this article. It gave me a lot of information that I really enjoyed reading.
ReplyDelete